Take a real survey, then see the results
Answer one of three short surveys, with no sign-up. Then see how one of them was built, what came back, and the reports it makes.
Each one takes about two minutes, asks for nothing but your honest answers, and opens in a new tab. When you’re done, close that tab — you’ll land right back here.
Sample survey
A short survey about whether you read instructions
There’s a question in here about the drawer of leftover furniture parts. You know the one.
Take the surveySample survey
The great potluck survey
Dish opinions, fork anxiety, and a skip question.
Take the surveySample survey
Mornings, weekends, and other negotiations
A short one about coffee, chaos, and how you actually start your day.
Take the surveyWhat the people you ask will see
A real survey, on a laptop and on a phone. Whatever mode the person answering happens to be in.


These are screenshots of a real survey, not mockups. Nothing has been tidied up for the picture.
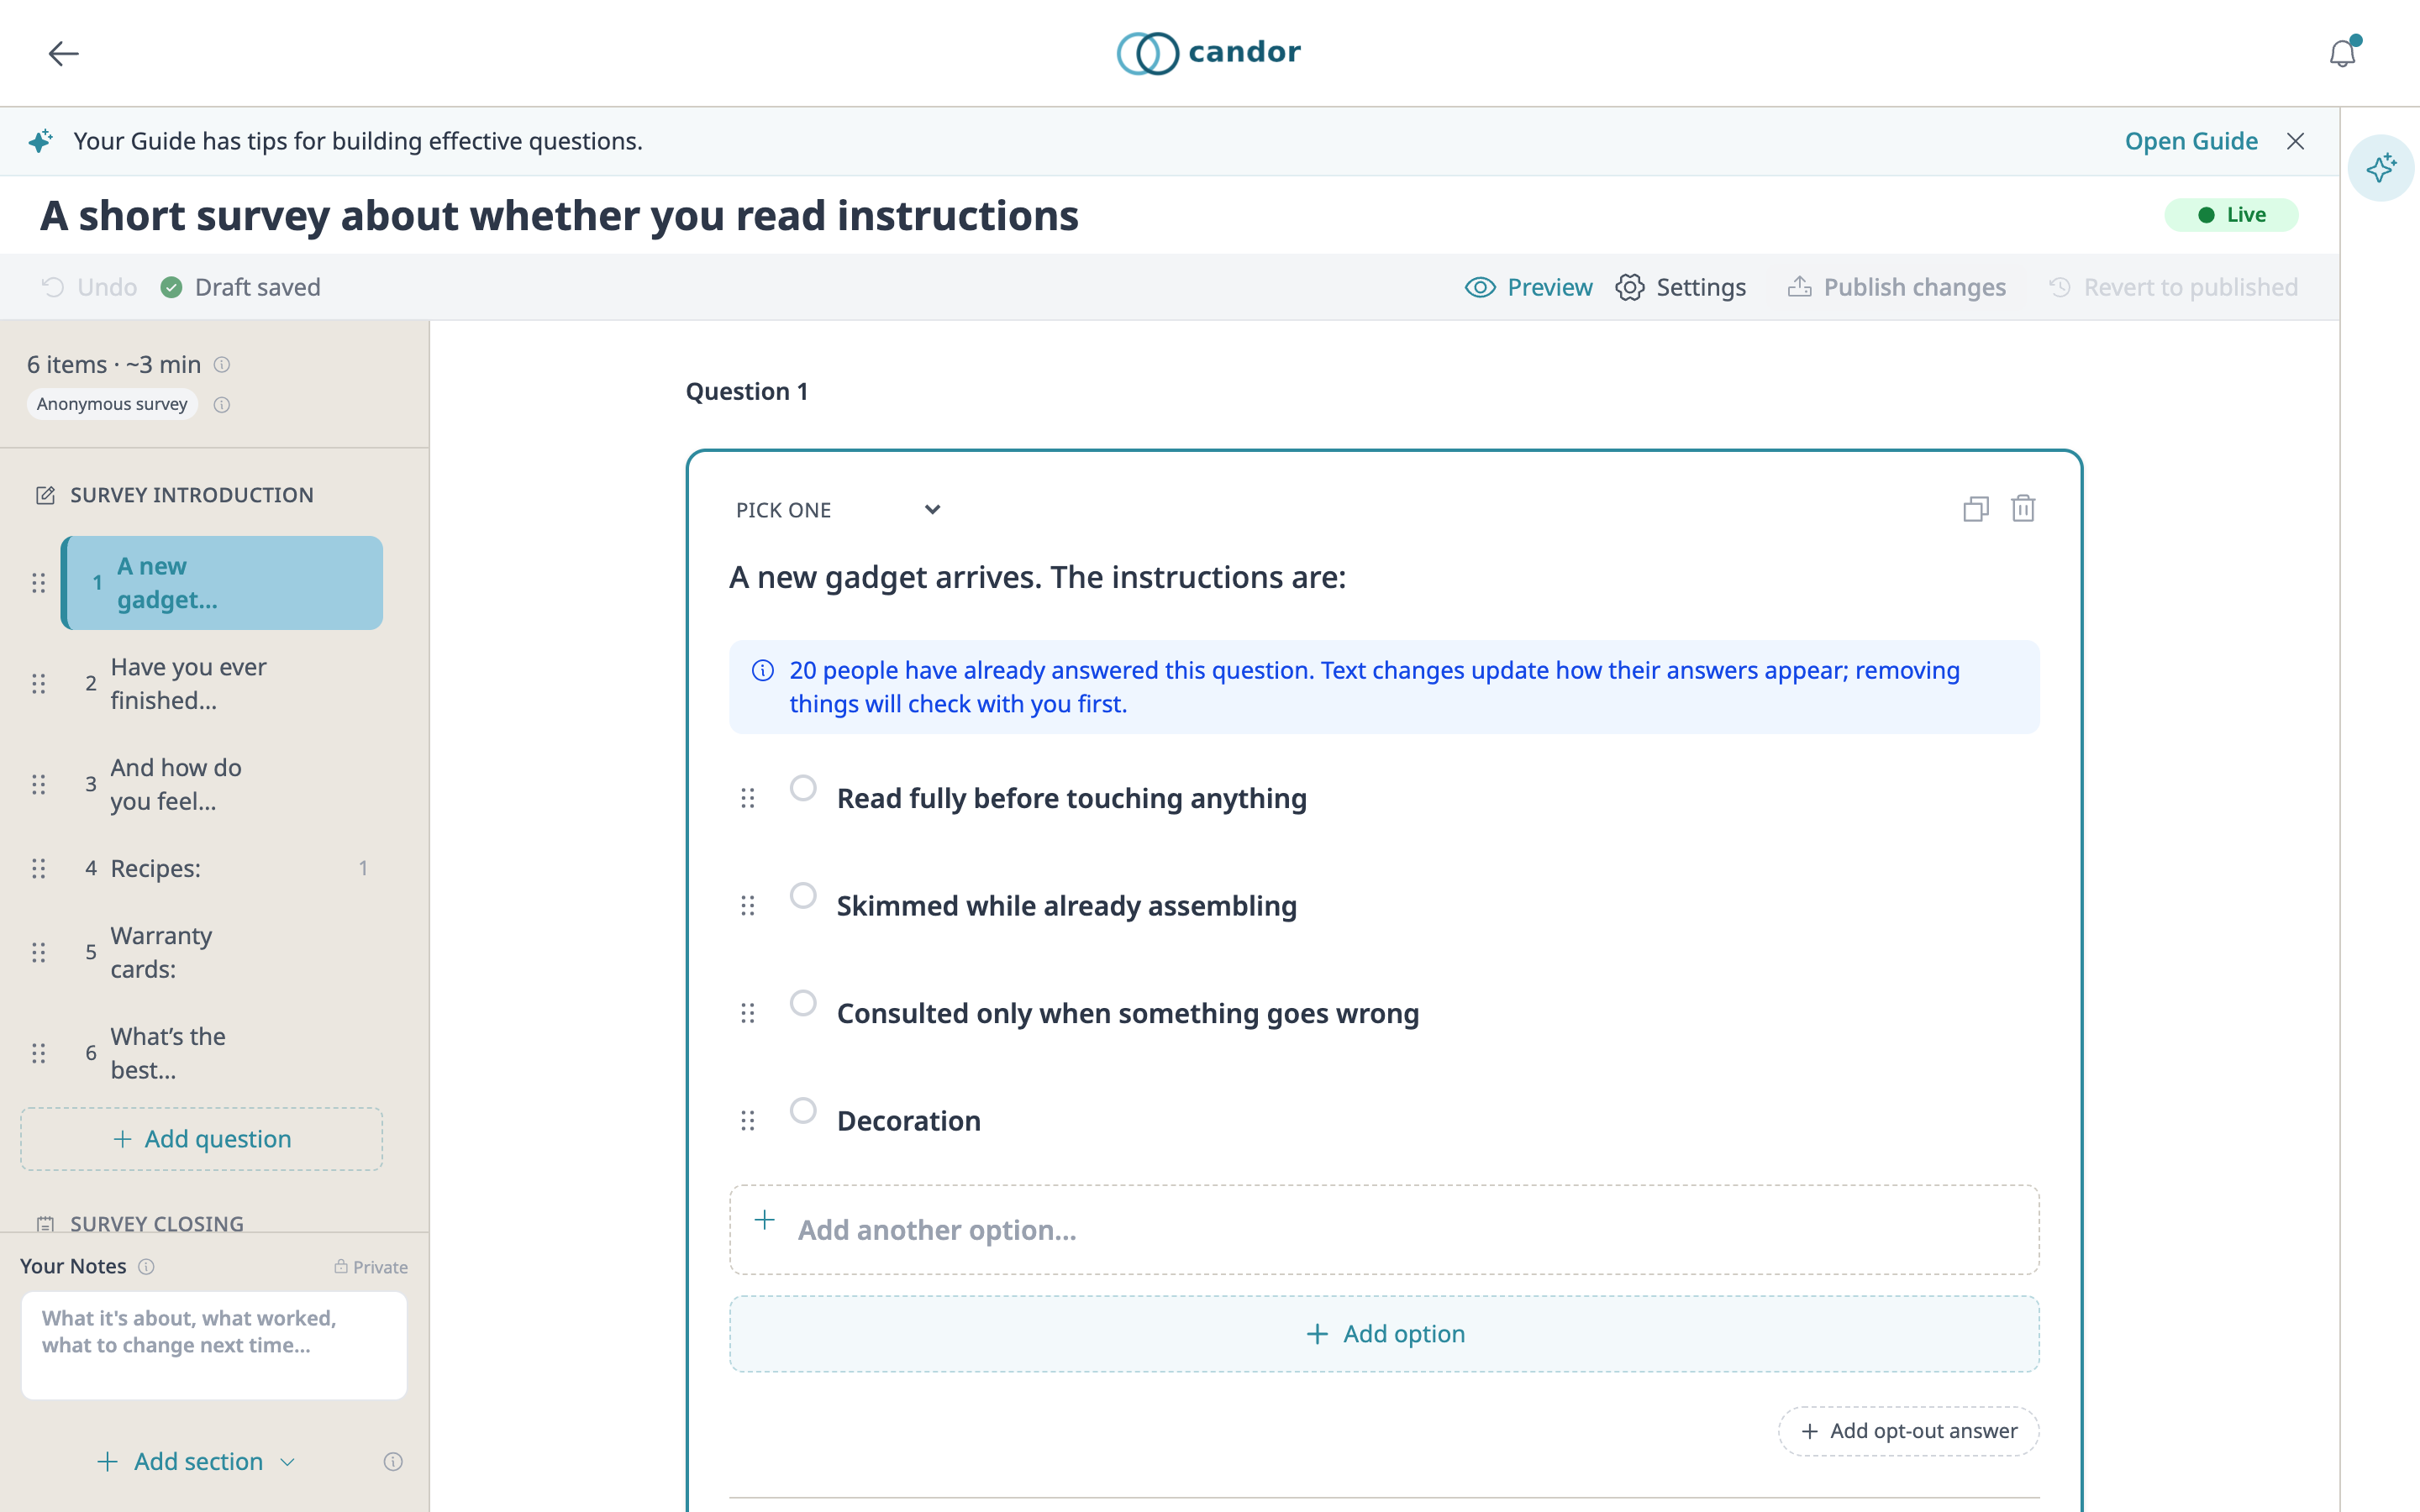
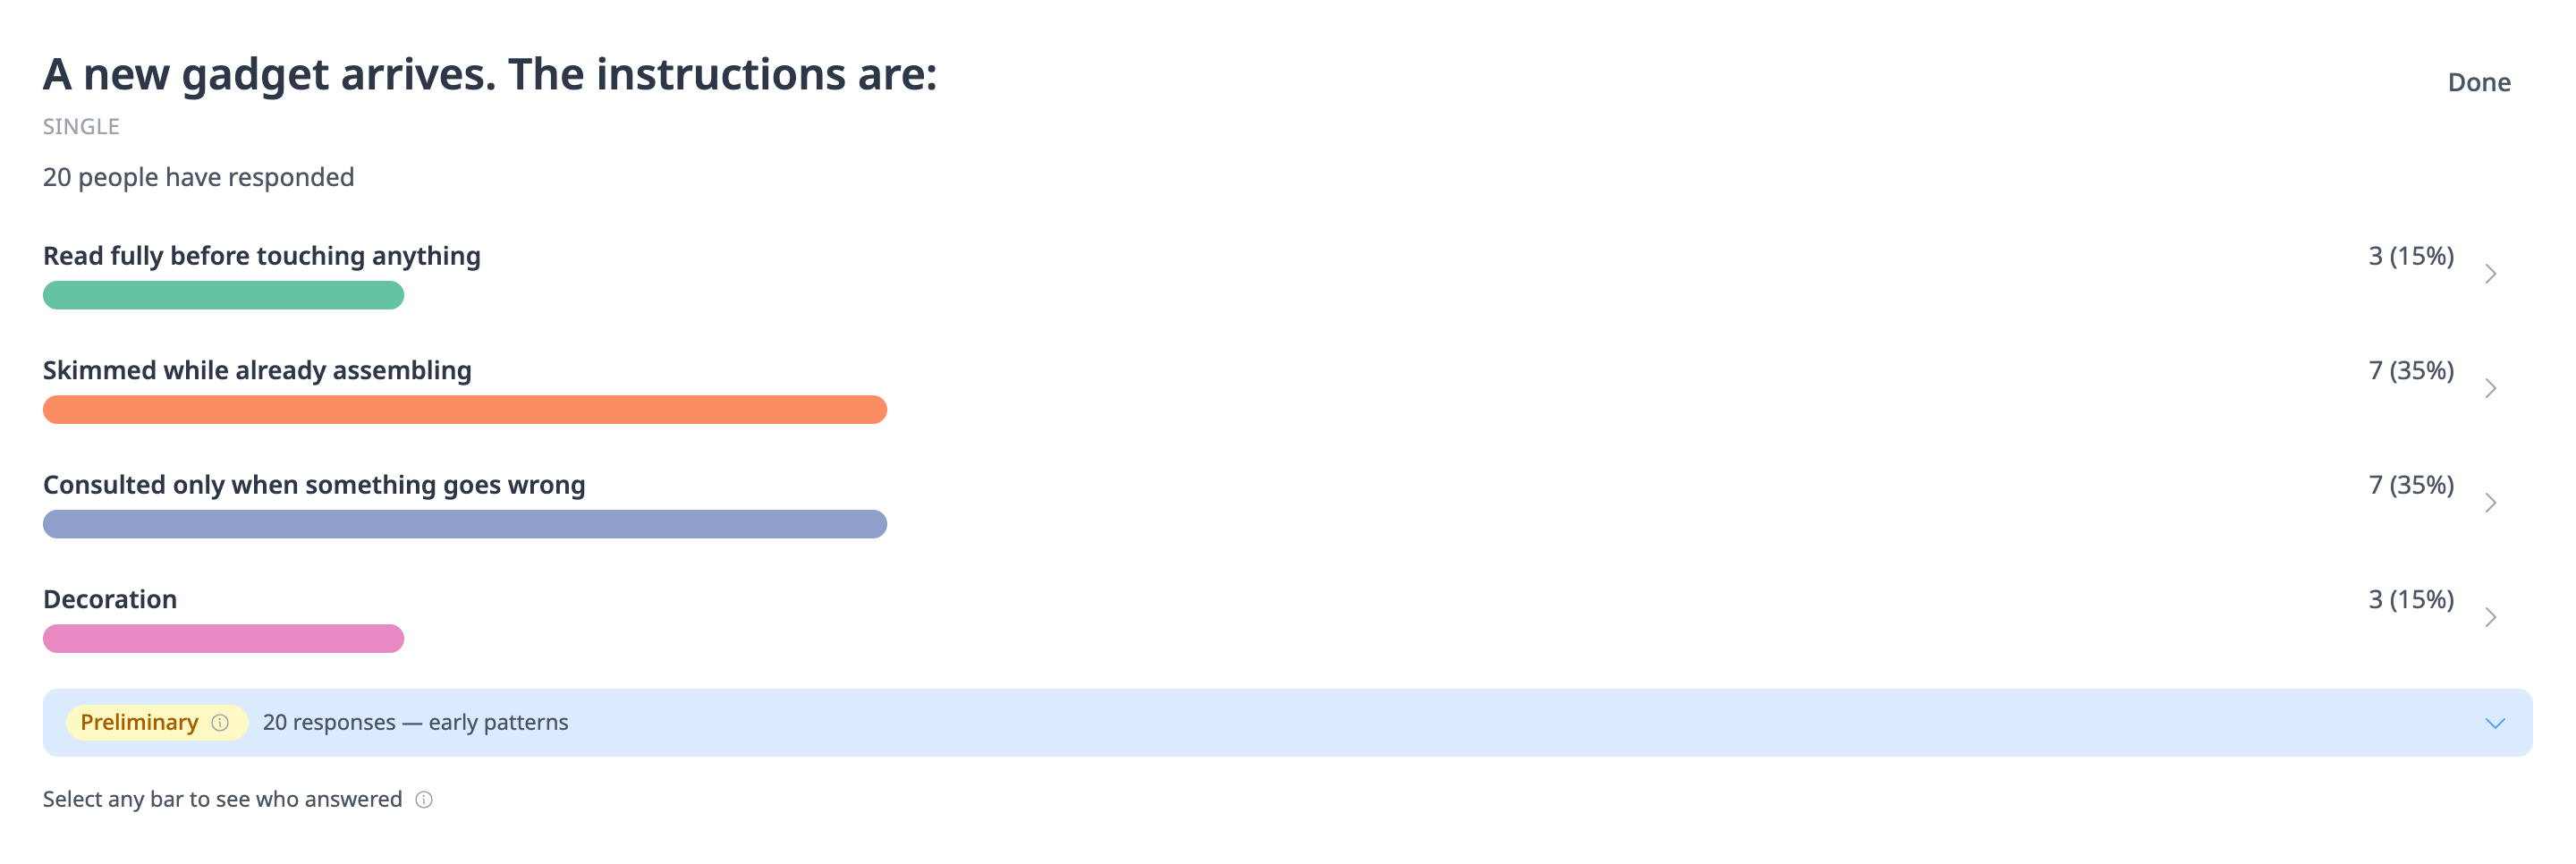
What you see when you make a survey
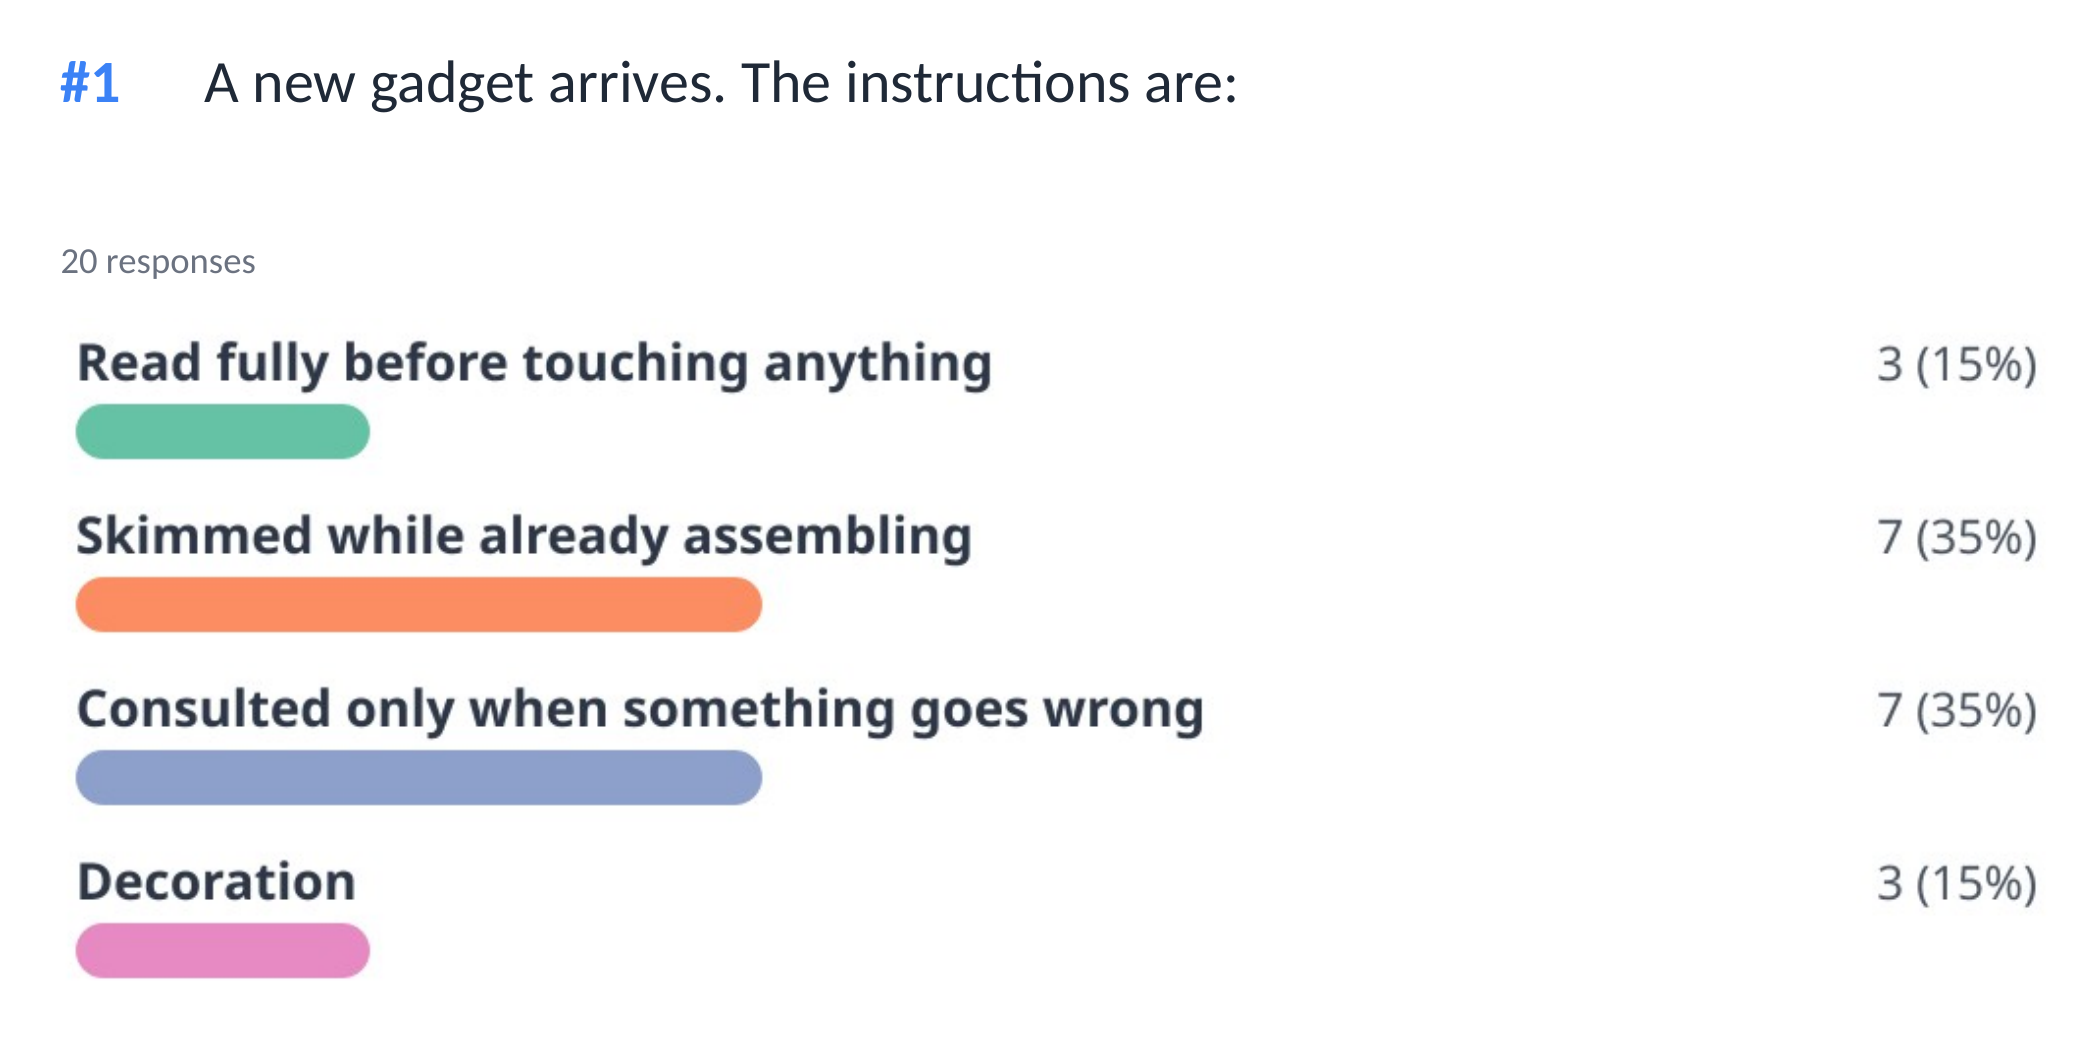
The builder, where you write it, and the results, when answers come in. Shown on the survey about reading instructions, with made-up answers, the one the files come from.
What the reports look like
Open real files from a sample survey. No sign-up needed.
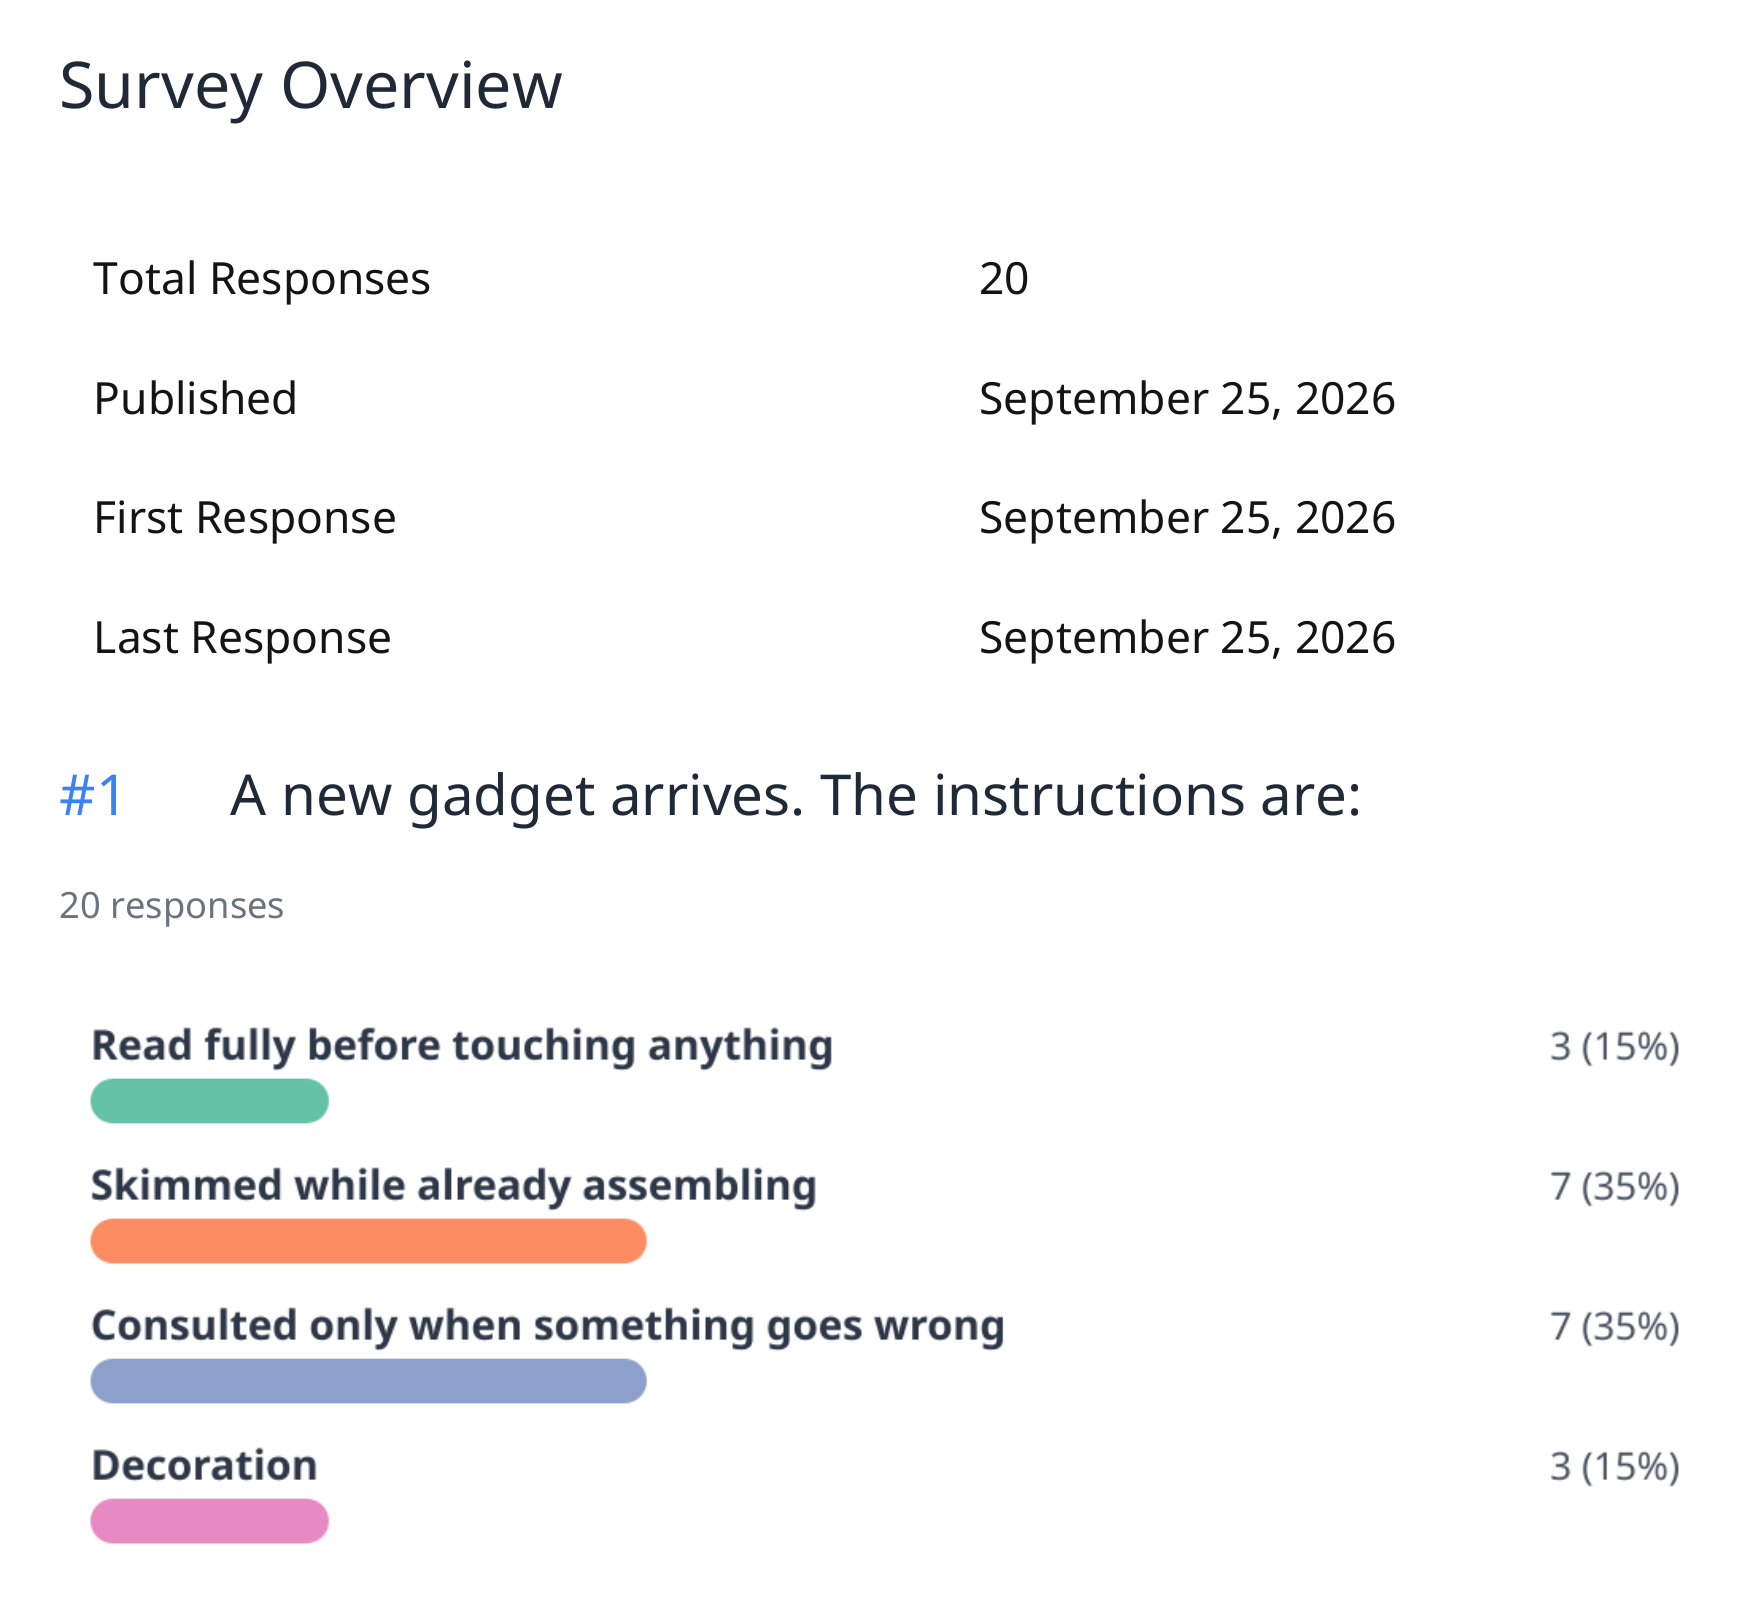 Open the PDF
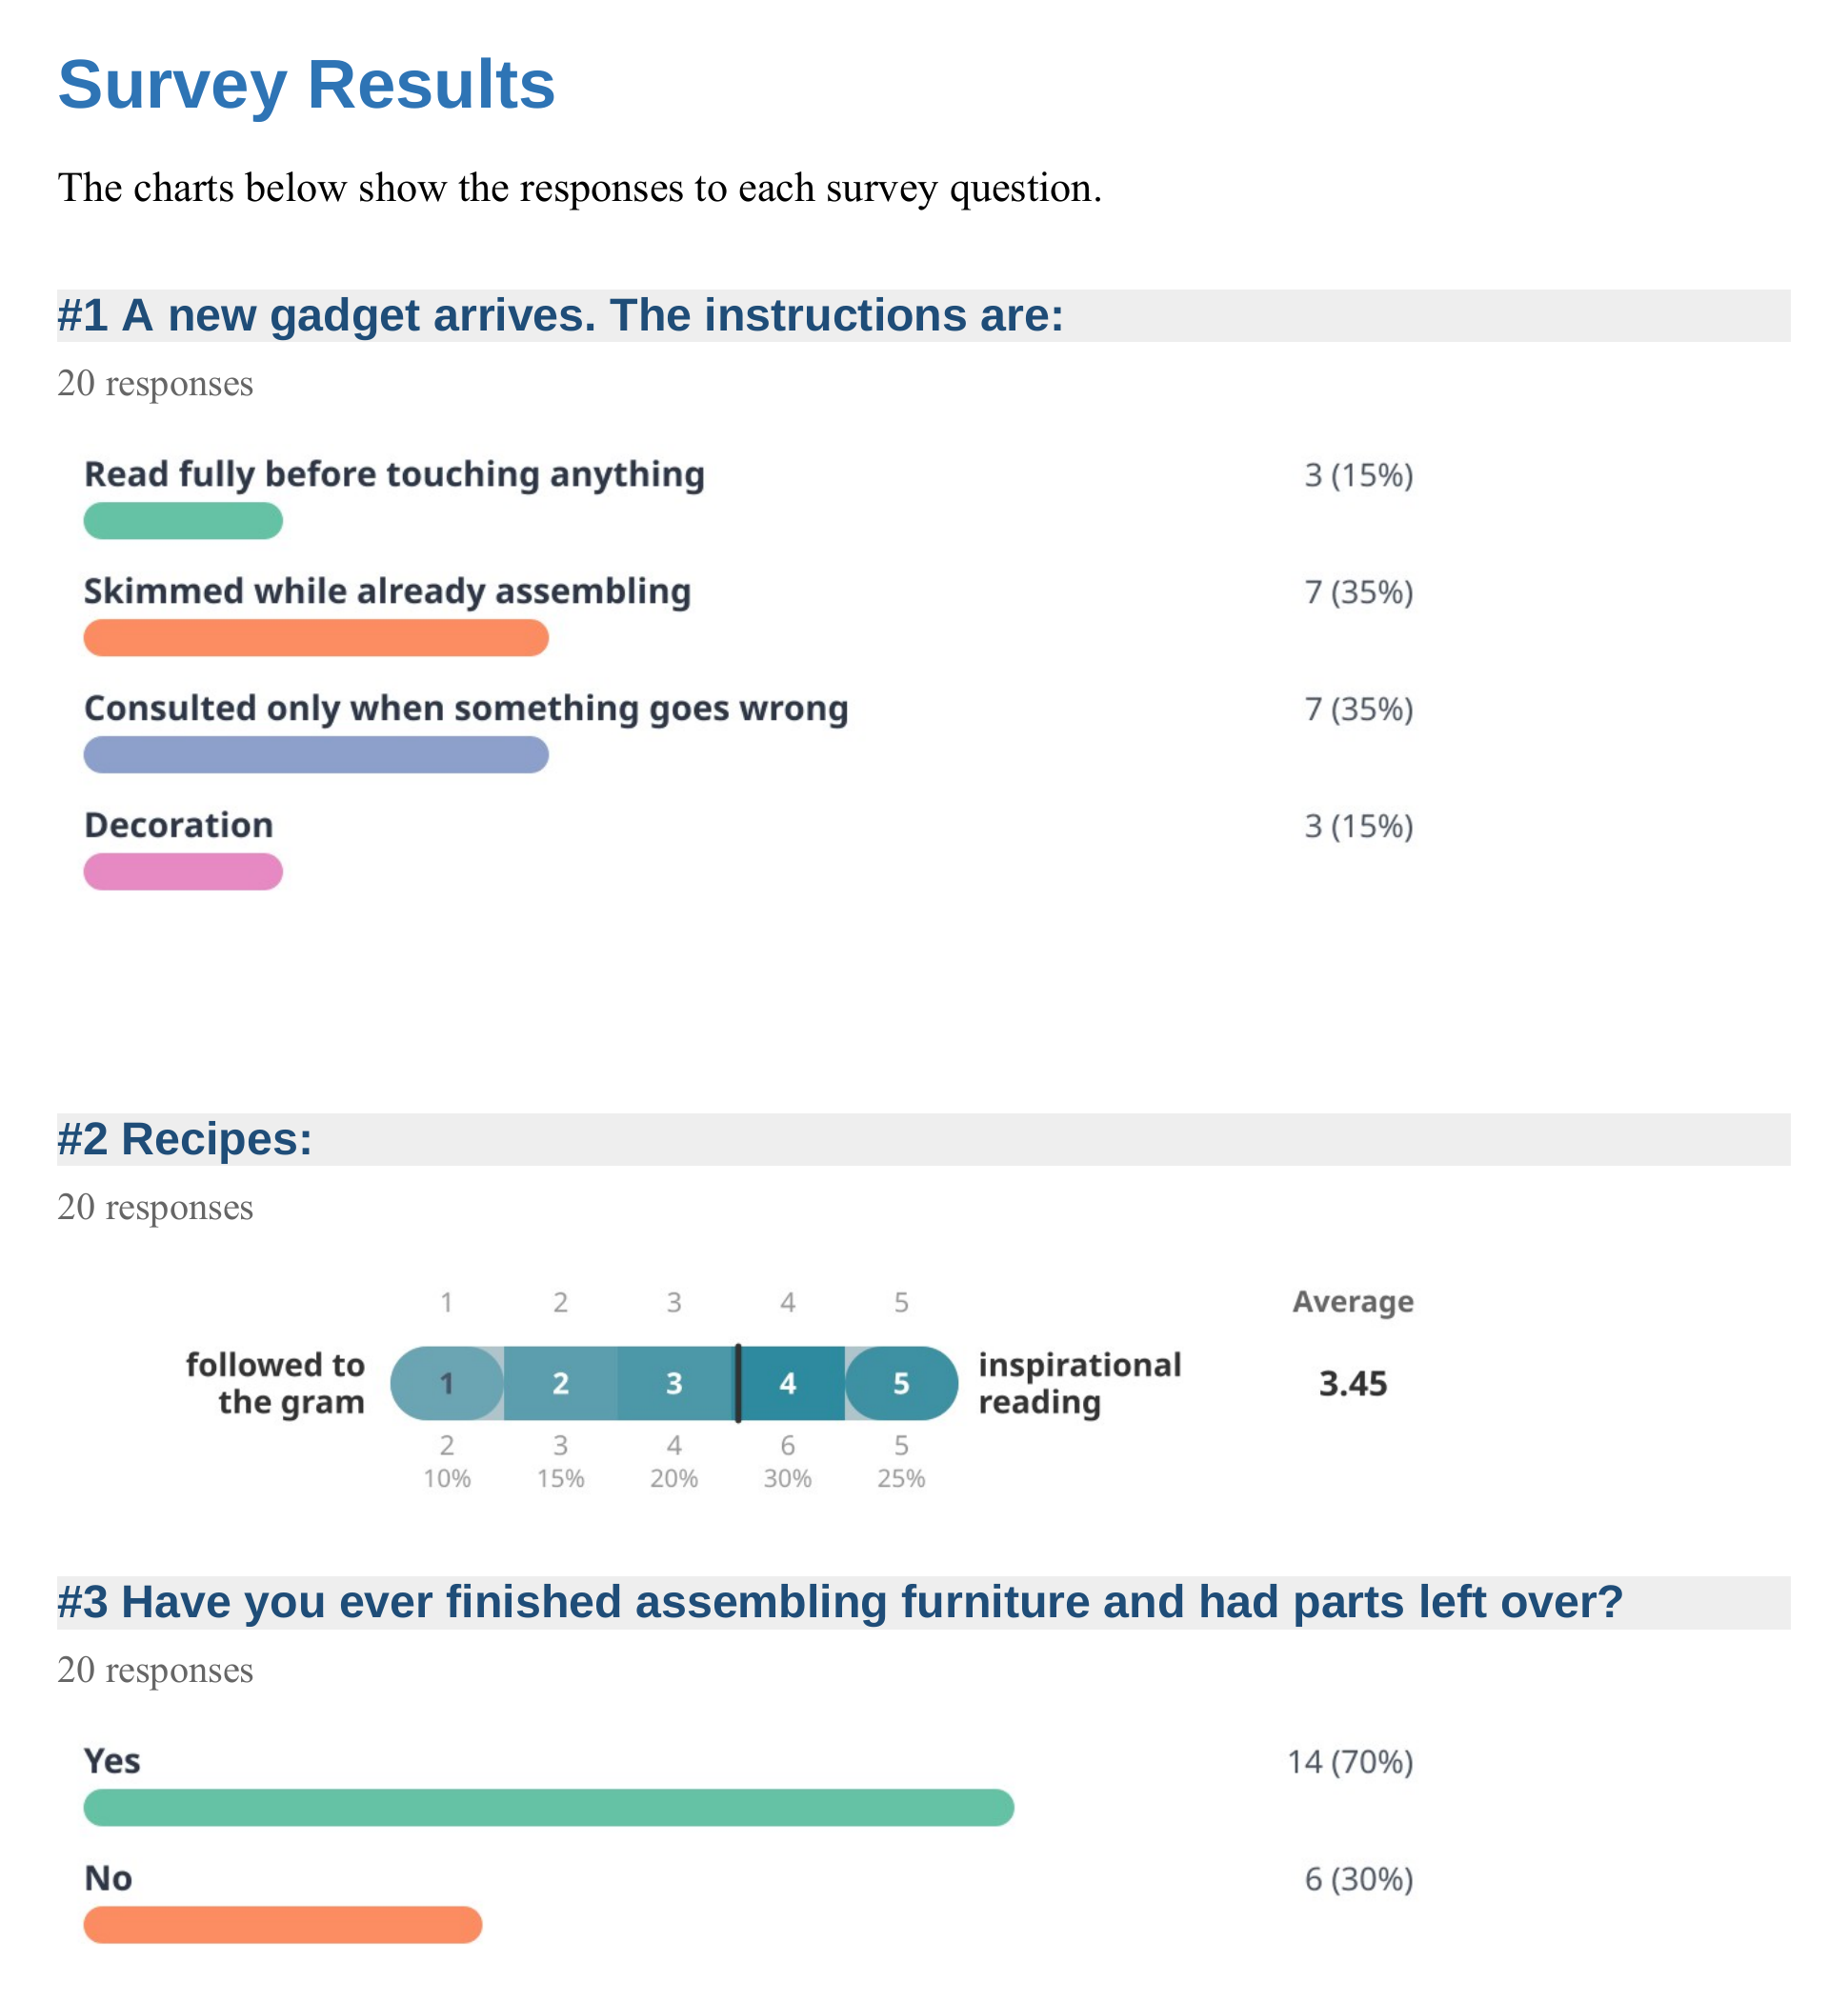 Download the Word file
 Download the slides
Download the data (CSV)Every answer, one row per person, ready for a spreadsheet.
The people in these files are made up, instruction-readers included, so your answer won’t be there.